Analyzing your application in the Preview
In the Preview click  to analyze the performance and inner structure of your application.
In addition to the Preview Visualize mode, Kanzi provides additional ways to help you analyze your application. See Measuring the performance of your application and Best practices.
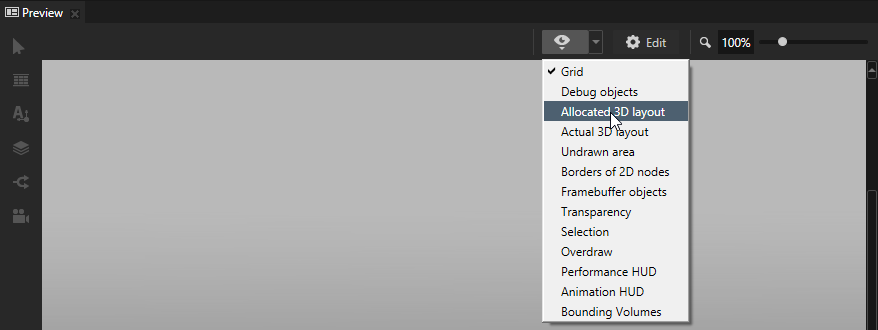
When in the Visualize mode, use the drop down menu to select what you want to view in the Preview:
- Grid shows the ground plane grid in Scene nodes.
- Debug objects shows visualization nodes, such as light and camera nodes.
- Allocated 3D layout shows bounding boxes of the spaces allocated to items under layouts. See Layout control nodes.
- Actual 3D layout shows bounding boxes of spaces used by items under layouts. See Layout control nodes.
- Undrawn area shows the updating of the areas beyond the application screen and the areas with content not rendered.
- Borders of 2D nodes outlines the borders of 2D nodes with striped lines.
- Framebuffer objects marks with orange stripes nodes that are rendered into textures and cause a framebuffer object switch. See Rendering best practices.
- Transparency marks transparent nodes with blue stripes. See Setting nodes for efficient rendering.
- Selection highlights the selected node. See Editing your application in the Preview.
- Overdraw draws nodes in x-ray view to enable you to identify the overlapping that causes overdraw. See Preventing overdraw with the Sorting Filter.
- Animation HUD shows animation performance statistics:
- Total time shows the amount of time used per frame for the execution of animation.
- Entries shows the amount of time used for the entry tree iteration.
- Samples(n) shows the amount of time used by animation data that consists keyframe interpolation for a single property attribute. The number in parentheses shows how many such animations were iterated.
- Blended(n) shows the amount of time used by animation data under Timeline Entry where the Timeline Entry contains Blend Mode other than None. The number in parentheses shows the number of such samples.
- Layout total time shows the amount of time Kanzi Engine used for iterating the layout nodes, such as Grid Layout and Stack Layout nodes.
- Currently running Timeline Entry graph. The smaller the graph, the faster the animation module of Kanzi Engine executes. It also shows if the graph has completed entries that still belong to the animation graph.
See Animations best practices.
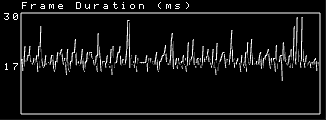
- Performance HUD shows the overall performance indicators of your Kanzi application during the last 300 frames including:
- Frame duration shows the time in milliseconds it took to render a frame. The top value in the Frame duration graph shows the longest, and the bottom value the average time it took to render a frame during the last 300 frames.
Use this information to identify performance bottlenecks in your Kanzi application. For example, you can use it to find out how to improve the performance of your application by distributing rendering across several frames. See Distributing rendering across several frames.
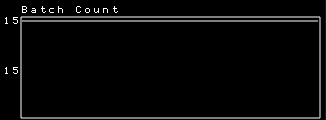
- Batch count shows how many individual draw calls were executed (
glDrawElements and glDrawArrays).
You can access the batch count using the Kanzi Engine API by calling getBatchCount().
The top value in the Batch count graph shows the highest number of batches during the last 300 frames, and the bottom value the number of batches in the last frame.
- Triangle count shows how many individual triangles were drawn in total during a frame.
You can access the triangle count in the Kanzi Engine API by calling getTriangleCount(). - Texture switches shows how many times new texture was bound to GPU.
You can access the texture switch count in the Kanzi Engine API by calling getTextureSwitchCount(). - Framebuffer object (FBO) switches shows how many framebuffer objects were bound to GPU. See Rendering best practices.
You can access the buffer switch count in the Kanzi Engine API by calling getFramebufferSwitchCount(). - Shader shows how many times a new shader was bound for the newly applied batch and how many individual shader uniforms were sent for the last frame. See Reducing shader switches.
You can access the shader switch count in the Kanzi Engine API by calling getShaderSwitchCount().
You can access the uniforms sent in the Kanzi Engine API by calling getUniformSendCount(). - Buffer switches shows how many vertex, index, and uniform buffer objects were bound to GPU.
You can access the buffer switch count in the Kanzi Engine API by calling getBufferSwitchCount(). - Buffer/texture data updates shows how many times new vertex buffer or texture data was uploaded to the GPU. If the same buffer is accessed for write and read operations, these heavyweight operations can cause delay in GPU execution. The ideal value is 0. For example, this value can increase when the text glyph cache needs frequent updates. In this case, to decrease the value reduce the Font Size.
You can access this in the Kanzi Engine API by calling getHeavyweightCallCount(). - View camera shows which Camera node is used for displaying the scene in your application.
- Resource memory consumption shows how much VRAM and RAM your Kanzi application uses.
- Animation player shows the current time in your application.
- Bounding volumes shows meshes in closed volumes.
See also
Measuring the performance of your application
Editing your application in the Preview
Preview

Open topic with navigation